

Under the Hood, Copart ($CPRT)
Company Analysis and Valuation


At a Glance
Company Copart, Inc
Ticker $CPRT · NASDAQ
Sector Industrials
Industry Online Vehicle Auctions & Remarketing
Market Cap $31.9 billion (at $33.06)
Status Approved
First Coverage April 2026
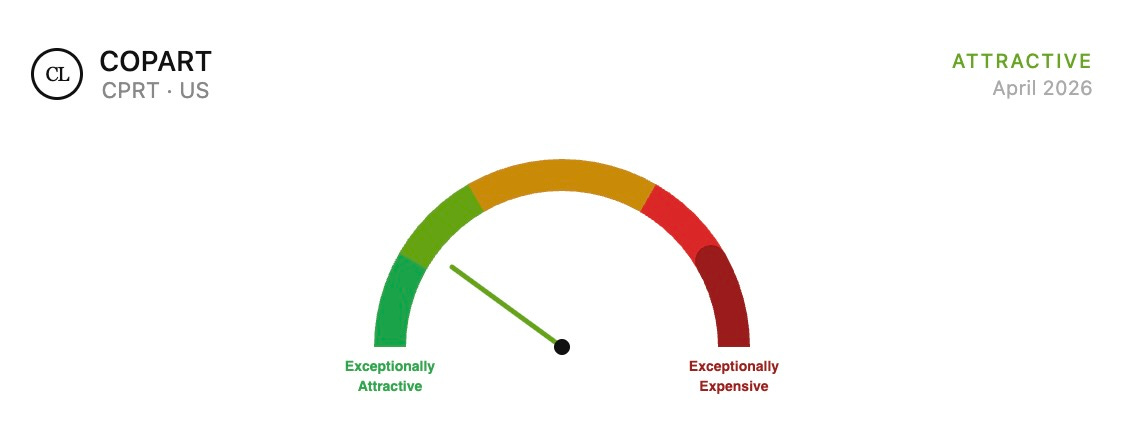
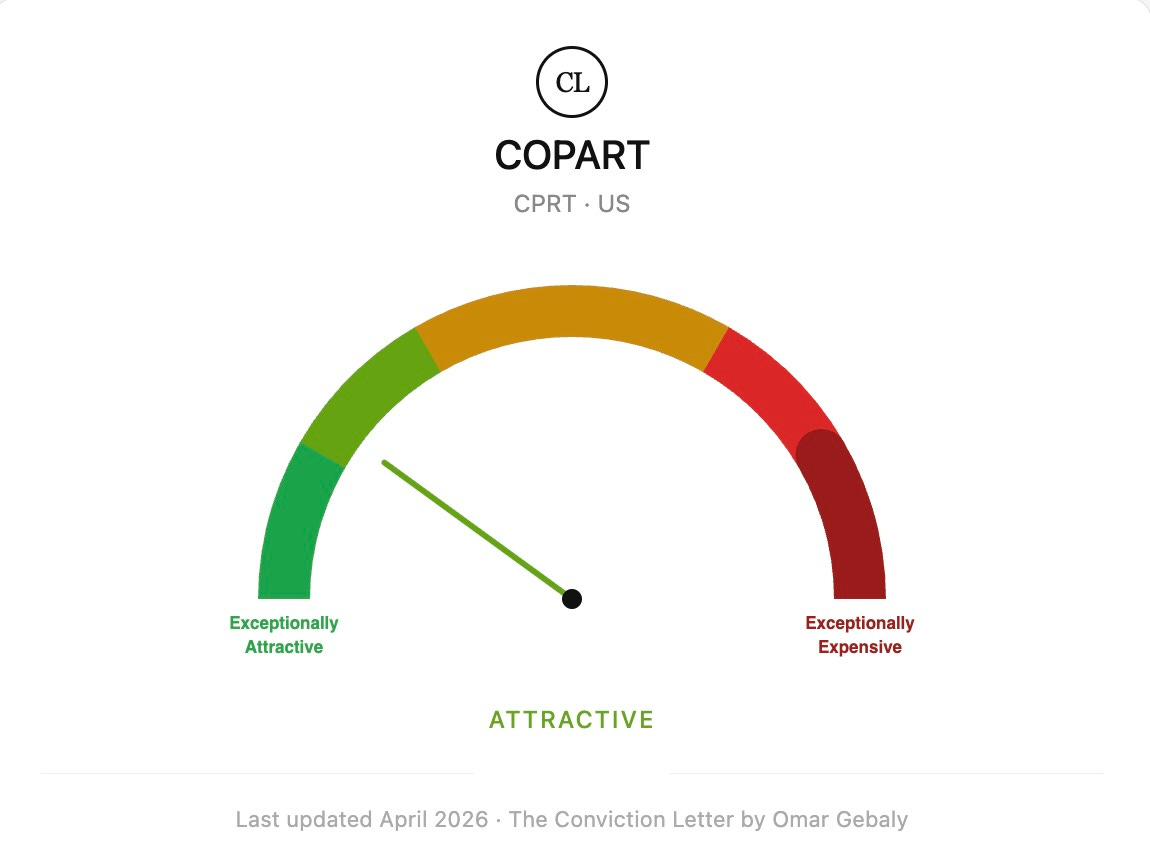
Valuation Zone Attractive (last updated in April 2026)
Disclosure: The author does not currently hold a position in $CPRT at the time of publication.
This report reflects the author’s personal views and is not an investment advice. Investing carries the risk of permanent capital loss. Read the full disclaimer here
The Outlook
Copart is one of the most quietly exceptional businesses in the United States. It operates in a market that most investors have never thought about, the online auctioning of salvage vehicles, and it has built a position in that market that is almost impossible to challenge. The business requires more land than almost any competitor can afford to acquire, it improves as it gets bigger, and its primary customers have no viable alternative. The stock price at the time of writing reflects a business priced for moderate expectations, which is unusual for a business of this quality.
The two risks that matter, concentration among insurance sellers, and the long-term question of autonomous vehicles, are real and deserve honest treatment. Neither, in my view, overrides the fundamental quality of what has been built here. This report addresses both directly.
1. The Business
What it Does
Copart operates online auctions for salvage and total-loss vehicles. When a car is involved in an accident and the insurance company determines that the cost of repair exceeds the vehicle’s value, the car is declared a total loss. The insurance company pays the policyholder the car’s pre-accident value, takes title to the vehicle, and then needs to dispose of it. That is where Copart comes in.
Copart takes possession of the vehicle, transports it to one of its storage facilities, photographs and documents it thoroughly through its proprietary technology, and lists it for sale on its VB3 online auction platform. Buyers from around the world, vehicle dismantlers, rebuilders, used car dealers, exporters, bid against each other in real time. Copart collects fees from both the seller and the buyer. The vehicle sells. The process repeats.
This description makes the business sound simple. It is operationally complex at scale, and that complexity is the foundation of the moat.
How the Company Makes Money
Copart earns fees at multiple points in the process. Sellers, primarily insurance companies, pay processing fees, listing fees, transportation fees, and storage fees. Buyers pay transaction fees, title fees, and loading fees. Because a significant portion of fees are tied to the final auction selling price under Copart’s Percentage Incentive Program, the company has a direct financial incentive to maximise the value each vehicle achieves. This alignment between Copart’s revenue and its sellers’ outcomes is a structural differentiator.
In fiscal year 2025 (ended July 31, 2025), Copart generated total revenues of $4.65 billion, of which $3.97 billion was service revenue and $678 million was vehicle sales revenue, the latter from markets like the UK where Copart purchases and resells vehicles on a principal basis.
History and Origin
Copart was founded in 1982 by Willis Johnson in Vallejo, California with a single salvage yard. The founding insight was straightforward but consequential: insurance companies needed a professional, efficient, and geographically distributed way to dispose of total-loss vehicles. The fragmented industry of local salvage dealers was not meeting that need well.
The business grew through acquisitions of regional salvage yards over the following decade and went public in 1994. For most of its early history Copart held physical auctions, buyers would travel to its yards to bid on vehicles in person. The transformative moment came when the company began migrating its auction process online in the early 2000s, completing the transition across its US operations by the mid-2000s. This was not an incremental improvement. It was a fundamental reshaping of who could participate in each auction.
By opening every sale to buyers anywhere in the world with internet access, Copart dramatically expanded the pool of bidders competing for each vehicle. More bidders means more competition. More competition means higher prices. Higher prices means insurance companies get better returns on their salvage. Better returns means insurance companies want to work with Copart. The flywheel that would define the business for the next twenty years was set in motion.
Willis Johnson stepped back from day-to-day operations and the company is now led by Jeffrey Liaw, who joined Copart in 2016 as CFO. He was promoted to President in 2019 and became Co-CEO in 2022 before taking over the sole CEO position.
Scale and Footprint
Copart operates in the United States, Canada, the United Kingdom, Germany, Brazil, Spain, Ireland, Finland, the UAE, Oman, and Bahrain. The US business generates approximately 83% of total revenues and is the operational core of the company.
Copart operates over 21,000 acres of land globally, they own more than 90% of their operational land outright, a key differentiator from competitors who typically lease their facilities. In the US alone, Copart owns or leases facilities in every state. The company owns approximately $2.39 billion worth of land on its balance sheet, a figure that significantly understates fair value given how long much of this land has been held and how dramatically land prices around major population centres have appreciated.
The international business is less mature and operates differently in some markets, particularly the UK, where Copart buys vehicles outright. But the global buyer base is central to the model: Copart now maintains a database of approximately 1 million registered members across every continent. While the company no longer discloses the precise split of US vehicles sold to international versus domestic buyers (in fiscal 2022, 36.4% of US vehicles sold went to international buyers), the scale of that global buyer pool, and the competitive pressure it places on every auction, remains central to the financial returns Copart delivers to its insurance sellers.
2. The Moat
Source of Competitive Advantage
Copart’s competitive position rests on three interlocking advantages that have strengthened over time. Understanding each one individually understates how they reinforce each other.
The first is physical infrastructure. Copart requires large parcels of land near major population centres to store the high volume of vehicles it processes before they sell. This land is expensive, increasingly scarce, and subject to complex local zoning restrictions that make new entrants face a fundamentally different cost environment than the one Copart faced when it was building its network. The company has spent decades and billions of dollars assembling a footprint that a competitor would need to replicate entirely, at today's land prices, with today's zoning restrictions, competing for the same properties in the same markets. No rational capital allocator would attempt it. This is not a moat that can be disrupted by software or a new technology. It is a physical asset base that took forty years to build.
The second is the global buyer network. Copart has accumulated hundreds of thousands of registered buyers across every continent. The value of this network is directly proportional to its size: more buyers means more competition for each vehicle, which means higher selling prices for insurance companies, which means insurance companies prefer Copart. A new entrant cannot simply build a marketplace without supply. It cannot build supply without having already demonstrated it can achieve competitive selling prices. The chicken-and-egg nature of this problem is the classic marketplace moat, and Copart has been building its side of it for four decades.
The third is the contractual relationships with insurance companies. While no single insurance company accounts for more than 10% of Copart's revenues, an important point to which we will return, the company has established long-term supply agreements with the major carriers. These agreements are built on trust, track record, and the demonstrable financial returns Copart generates for its sellers. Switching costs are not contractual so much as they are practical: an insurance company that moves its business to a smaller competitor will likely see lower auction returns, a worse buyer experience, and disruption to its operations. The cost of switching exceeds the benefit in almost every realistic scenario.
Evidence of the Moat
The financial record is unusually clean on this point. Copart has maintained ROIC consistently above 20% in every year of the past decade, averaging approximately 28% over the last ten years. Operating margins have ranged between 32% and 42% throughout this period. Gross margins have held in a narrow band around 45% for a decade. These are not the numbers of a business that competes on price. They are the numbers of a business that sets the standard.
The most revealing evidence of moat is what has happened to the competition. Insurance Auto Auctions (IAA), Copart's primary US competitor, was acquired by Ritchie Bros. Auctioneers in 2023 after years of underperformance relative to Copart. The combined entity has not threatened Copart's position in any meaningful way.
Moat Trajectory
The moat is strengthening, not weakening. Each additional facility Copart opens makes the network more valuable to insurance sellers because of improved geographic coverage. Each additional buyer who registers on the platform increases the competitive pressure on every auction. Each year of accumulated auction data improves the company’s IntelliSeller tool, which uses machine learning to help sellers optimise their pricing decisions. These are all self-reinforcing dynamics that become harder to replicate as they compound.
Competitive landscape
Copart’s meaningful competition is effectively limited to IAA (now part of Ritchie Bros.) in the US. This is a two-player market for insurance-company salvage vehicles at national scale. Local and regional operators exist but cannot replicate the global buyer network or the geographic coverage that national carriers require. The fact that this market has not attracted more serious competition in four decades is itself informative. The capital requirements are enormous, the zoning challenges are real, and the buyer network takes decades to build.
3. Financial Performance
Revenue Growth
Copart has grown revenue from $1.15 billion in fiscal 2015 to $4.65 billion in fiscal 2025, a compound annual growth rate of 15% over a decade. For a business operating in physical infrastructure with significant real-world constraints, sustaining that rate over ten years is exceptional.
The growth has been driven by four forces operating simultaneously: an increase in total loss frequency rates as vehicles have become more technologically complex and therefore more expensive to repair; market share gains at the expense of smaller regional competitors; geographic expansion both within the US and internationally; and an increase in revenue per transaction driven by higher average vehicle values and an expanded global buyer network.
In fiscal 2025, total revenues grew 9.7% year over year to $4.65 billion. Service revenues, the higher-quality, fee-based component, grew 11.4% to $3.97 billion. The recent moderation from earlier rates reflects the natural effect of a larger base and some normalisation following the elevated total-loss activity of the pandemic years.
Profitability
Copart’s profitability record is one of the clearest expressions of the structural strength of its competitive position. Operating margin in fiscal 2025 was 36.5%, above the ten-year average of 36.3% and meaningfully higher than the 30.1% the business generated a decade ago in fiscal 2015. The direction of travel matters as much as the level: a business that has expanded operating margins by 6.4 percentage points over ten years while growing revenue at 15% annually is not merely maintaining its competitive position, it is strengthening it. Operating income compounded at 17.3% annually from fiscal 2015 to fiscal 2025, growing from $344 million to around $1.70 billion. This outpaced revenue growth, which is precisely what margin expansion looks like in the financials.
Net income in fiscal 2025 was $1.55 billion, up 13.9% from $1.36 billion in fiscal 2024. The net margin of 33.4% is above the ten-year average of 29.5% and almost double the 19.2% the business earned in fiscal 2015. The steady expansion in net margin reflects operating leverage, the benefit of a larger and more efficient network, and the growing contribution of interest income, the company earned $178.9 million in net interest income in fiscal 2025 on its $4.79 billion net cash position, a meaningful source of earnings that did not exist a decade ago.
On earnings per share: diluted EPS grew from $0.21 in fiscal 2015 to $1.59 in fiscal 2025, a compound annual growth rate of 22.4%, ahead of both revenue and net income growth. This performance was bolstered by an overall reduction in diluted share count, which fell from approximately 1.05 billion in fiscal 2015 to 978 million in fiscal 2025. While the share count has drifted slightly higher since 2021 due to stock-based compensation, the long-term decline reflects the cumulative impact of Copart’s historical share buybacks (especially the aggressive buybacks between 2015-2017) and disciplined capital allocation.
Free Cash Flow
Free cash flow grew from $186 million in fiscal 2015 to $1.23 billion in fiscal 2025, a compound annual growth rate of 20.8% over a decade. That represents a 6.6-fold increase in the business’s capacity to generate cash, which is a meaningful claim about the quality of the underlying economics.
The capex-to-operating-cash-flow ratio tells a particularly revealing story about where the business stands today. Over the past decade, this ratio averaged approximately 44%, meaning Copart reinvested roughly 44 cents of every operating dollar back into the physical infrastructure that generates its competitive moat. In fiscal 2025, that ratio fell to 31.6%, its lowest level in ten years. The business is indeed entering a higher-harvest phase in the US, but it remains an investment-heavy business globally.
Return on Invested Capital
Over the past decade, ROIC has averaged 28.4% and reached as high as 32% in fiscal 2022. In fiscal 2025, ROIC was 29%, essentially in line with the long-run average. This consistency is more impressive than a single peak figure. A business that has compounded at 15% annually in revenue while sustaining high returns on incremental capital is, by the standard definitions, a genuine compounder. Every dollar reinvested in the business has generated returns well above any reasonable estimate of the cost of capital in every year of the available record.
Balance Sheet
Copart’s balance sheet at July 31, 2025 was exceptional. The company held $2.78 billion in cash and restricted cash plus $2.01 billion in held-to-maturity securities, a combined liquid position of $4.79 billion against total financial debt of effectively zero. Total liabilities of $883 million were overwhelmingly operational in nature. This is a fortress balance sheet. It provides management with complete flexibility to act, whether to acquire land, weather a severe recession, respond to catastrophic weather events, or return capital to shareholders. The net cash position also generates meaningful interest income that did not exist in prior cycles, adding a new dimension to earnings quality.
Capital Expenditure
Copart spent $569 million on capex in fiscal 2025, the majority directed toward land acquisition and facility development. Importantly, the majority of Copart’s capex is growth-oriented, acquiring land and building new facilities that generate long-term structural barriers, rather than maintenance capex spent on preserving the existing asset base. This distinction matters when evaluating the quality of the free cash flow figure.
4. Growth Levers & Addressable Market
Copart is not a business that has exhausted its runway. The US network is maturing, but that maturation is precisely what frees capital and management attention for the next phase of growth. There are four distinct levers that can drive the business forward from here, and they are not speculative: each has evidence of traction today.
A) The structural Tailwind in Total Loss Frequency
The single most important driver of Copart’s domestic volume is total loss frequency, the percentage of accident-involved vehicles that insurers choose to declare a total loss rather than repair. In fiscal 2025, CEO Jeff Liaw described the full-year total loss frequency rate of 22.2% as an all-time annual high. This is not an anomaly. It is the result of forces that have been building for decades and show no sign of reversing.
Modern vehicles are fundamentally more expensive to repair than their predecessors. Advanced driver assistance systems, cameras, sensors, integrated infotainment, and complex structural materials mean that even moderate collision damage frequently triggers repair estimates that exceed the vehicle's value. Electric vehicles add a further dimension: EVs require approximately four additional labour hours per repair compared to internal combustion vehicles and carry roughly 30% higher repair costs. As EV penetration grows and as ADAS technology becomes standard across more model lines and price points, the economics of repair versus total loss continue to shift in Copart's favour. The average age of vehicles on US roads has also reached 12.8 years, meaning a large portion of the fleet consists of older vehicles where even modest damage tips the repair-versus-salvage calculation toward salvage. Each of these trends compounds the other, and none of them is cyclical.
B) International Expansion, the Majority of the Opportunity
The US salvage auction market is estimated at approximately $3.4 billion in 2024 and is projected to reach $7.2 billion by 2030, growing at a 13.7% CAGR. Copart’s domestic revenue in fiscal 2025 was approximately $3.8 billion, meaning the company is already capturing the largest share of a market that is still growing. The domestic runway is real but finite.
The international opportunity is a different order of magnitude. The global online salvage auction market was estimated at $10.6 billion in 2024 and is projected to reach $27.2 billion by 2030 at a 17.4% CAGR, a faster growth rate than the US market and from a base where Copart's penetration is a fraction of what it has achieved domestically. In fiscal 2025, international service revenue growth reached 18.9% for the full year, significantly outpacing the 10.4% growth in U.S. service revenue. The direction of travel is clear.
The specific international market opportunities are substantial. Germany's online salvage market was worth approximately $950 million in 2024 and is projected to grow at a 21% CAGR through 2030, a market where Copart has been building infrastructure since 2017 and where the transition from a principal-based model to a consignment model is already delivering margin improvement. Brazil sits at approximately $480 million with mid-teens growth. India, which Copart briefly entered and then paused to wait for the market to develop further, is estimated at $230 million and growing at approximately 23% annually, a market that Copart is well-positioned to re-enter as formal insurance penetration and salvage regulation matures. In the UK, Copart already holds approximately 60–70% of the insurance-customer market, making it the dominant operator in Europe's most developed salvage market. Asia-Pacific is the fastest-growing region globally, expanding at a 16–24% CAGR depending on the source.
Copart's international buyer pool is a direct competitive advantage in these markets. The most recent available data indicates that international buyers purchasing US vehicles were acquiring vehicles significantly higher in value than comparable vehicles purchased by domestic US buyers, a reflection of the quality and purchasing power of the global member base Copart has assembled over four decades. That same buyer network can be directed toward inventory in Germany, Brazil, or any market Copart enters, providing an immediate advantage that a local competitor could not replicate. This is network effects working across geographies, not just within them.
C) Expanding Beyond Insurance, Blue Car and Adjacent Categories
Approximately 81% of Copart’s vehicle volume originates from insurance company sellers. That concentration is a risk, but it also reveals the size of the untapped opportunity in non-insurance channels.
Blue Car, Copart’s service offering aimed at banks, rental car companies, and fleet operators, delivered strong double-digit growth in fiscal 2025, as reported in the annual report. This is not a minor product line. Banks and financial institutions need to liquidate repossessed vehicles and lease maturities efficiently; fleet operators and rental companies cycle through vehicles on a regular cadence and need the same combination of geographic reach, global buyer access, and transparent pricing that insurance companies value. As Copart's platform becomes better known outside the insurance vertical, the addressable supply base expands materially without requiring any new infrastructure investment.
Purple Wave, Copart's heavy equipment and agricultural machinery auction platform, delivered continued growth in fiscal 2025. Heavy equipment and farm machinery represent a large and fragmented global market that benefits from exactly the same dynamics that made Copart successful in salvage vehicles: a global buyer pool competing for local inventory, transparent price discovery, and specialist services for sellers who lack efficient alternatives. This is early innings, but the model is proven.
D) The EV Transition as a Structural Accelerator
Electric vehicles are widely discussed as a long-term threat to Copart through the autonomous vehicle channel. The near-term reality is almost exactly the opposite. EVs are more expensive to repair than internal combustion vehicles by a meaningful margin. Battery damage, which occurs in a significant proportion of EV collisions, is frequently uneconomical to repair at all, either because the battery module is deeply integrated into the vehicle’s structure or because replacement costs are prohibitive. This drives EV total loss rates materially above ICE vehicle rates at comparable damage severity levels. As EV penetration of the vehicle fleet grows, still in its early stages globally, it adds a structural tailwind to Copart’s volume that did not exist a decade ago and that will intensify over the coming years before autonomous vehicle adoption becomes a countervailing force.
What the TAM Picture Tells us
A business that controls roughly half of the US domestic market, that is in the early stages of penetrating a $10.6 billion global market growing at 15% annually, and that is actively expanding into adjacent vehicle categories through Blue Car and heavy equipment, is not running out of room. The presence of a massive growth runway is undeniable; the real variable is Copart’s ability to scale operations and deploy capital with its trademark efficiency. Given its historical financial performance, the company has already proven it possesses the discipline to execute
5. Management
Leadership and Tenure
Copart is effectively a founder-influenced business. Willis Johnson, who founded the company in 1982, remains Chairman of the Board. His operating philosophy, own the land, build the infrastructure, focus on seller returns, expand the buyer network, is deeply embedded in how the company operates.
Liaw joined in 2016 as CFO. He brought a sophisticated private equity background (formerly at TPG Capital) that sharpened the company's approach to capital allocation, ROIC, and international M&A. He served as Co-CEO with Jay Adair before becoming the sole CEO on April 1, 2024.
The transition from founder Willis Johnson to his son-in-law Jay Adair (now Executive Chairman), and then to Jeff Liaw, represents one of the most successful leadership successions in the industrial sector. The team's ownership mindset is reflected in their lack of a dividend; they prefer to reinvest every dollar into land or opportunistic buybacks.
Skin in the Game
Insiders, including Willis Johnson and his affiliates, collectively own a significant portion of Copart’s outstanding shares, exceeding 11% of shares outstanding as of the most recent proxy. Executive compensation is weighted heavily toward equity, tying financial outcomes directly to long-term share price performance. Options issued to senior executives include market conditions requiring the stock to trade above a specified price threshold before exercise, a feature that further aligns incentives with shareholder value creation.
Capital Allocation Track Record
Copart’s capital allocation record reflects a management team that has consistently prioritised long-term value over short-term return metrics. The primary deployment of free cash flow has been into land acquisition and facility development, investments that have generated ROIC averaging 28% over the past decade and that have deepened the structural barriers protecting the business.
Copart has historically been a reluctant repurchaser, preferring to build a massive cash pile for internal reinvestment. Aside from a defining $739 million buyback in 2017, the company remained largely dormant on this front until early 2026, when it deployed $500 million to take advantage of recent share price volatility. Combined with a total absence of dividends since its 1994 IPO, this reflects a management team strictly focused on long-term compounding over immediate distributions.
The primary reservation is the accumulation of $4.79 billion in liquid assets earning treasury rates when the business historically generates returns above 20% on invested capital. This is capital that could be working harder.
Communication and Transparency
Copart’s management communicates with shareholders in a manner that reflects genuine confidence in the business and a willingness to engage with difficult questions. Earnings calls are substantive. The risk factor disclosures in annual filings acknowledge real challenges rather than papering over them. The 10-K filings are unusually detailed about the operational mechanics of the business.
6. Valuation
Current valuation
Our valuation framework measures how much of the sum of a company’s future cash flows, discounted back to today at an appropriate rate, is already embedded in the current stock price. Rather than expressing this as a precise figure, we express it as an approximation in years.
At the time of this report, with the stock trading at $33.06, the market is pricing Copart at approximately 16 years of discounted future cash flows. This is an approximation, not an exact calculation. The assumptions embedded in our model are consistent with the company’s current and historical operating performance, they are not heroic, and they are not pessimistic. This figure is monitored and updated on a monthly basis as the stock price and business performance evolve. This places the business in the Attractive zone of the Conviction gauge.
What 16 years means
What 16 years means in practical terms is this: the current price assumes that Copart will stop generating meaningful cash flows after year 16. Every year of cash generation beyond that point comes to you as an investor for free.
For a business with the structural characteristics described in this report, physical infrastructure that compounds in value, a buyer network that deepens with each passing year, contractual relationships with insurance companies that have persisted for decades, and a non-discretionary market that has existed since automobiles did, the question of whether Copart will still be generating substantial cash flows in year 17 and beyond seems like a reasonable bet.
Hold, Add, and Exit Logic
The Conviction Valuation Framework is not a buy-and-sell signal generator. It is a tool for thinking about price relative to value, and for making disciplined capital allocation decisions across the Conviction Universe.
The current Attractive zone suggests the price does not demand excessive optimism about the future. For a business of this quality, that is a reasonable entry point.
The general logic across all five zones is as follows. In the Exceptionally Attractive and Attractive zones, the price is working in your favour, you are receiving more embedded future cash flows per dollar deployed than the market typically offers for a business of this quality. In the Hold zone, the business is fairly recognised, neither compelling to initiate a new position nor a reason to exit one already held. In the Expensive and Exceptionally Expensive zones, the price is embedding a level of optimism that the historical record does not automatically support.
My approach is straightforward: when a position moves into the Expensive zone, I sell and reallocate the capital to other quality businesses in the Conviction Universe where the price sits in the Attractive and Exceptionally Attractive zones. The logic is simple, if you own a collection of exceptional businesses, your capital should always be working in the most attractively priced names available to you. Holding an Expensive position when an Attractive alternative exists is an opportunity cost that compounds against you over time. Discipline on the exit is as important as discipline on the entry.
Growth Engines
Every stock price is driven by one of two engines, or both simultaneously. Understanding which is working in your favour, and which might work against you, is as important as understanding the business itself.
The first engine is fundamental growth. Over time, a stock price tracks the growth of free cash flow per share. If a business compounds its FCF per share at 15% annually, that is roughly what the fundamental engine contributes to investor returns over a full holding period. It is steady, it is predictable, and it is the engine that quality businesses run on indefinitely.
The second engine is valuation re-rating. When a stock is mispriced, when the market is embedding fewer years of future cash flows than the business's quality and durability justify, the price tends to correct upward simply to reach fair value. This engine can produce returns that dwarf what fundamentals alone would deliver. It can also run in reverse: when a stock sits in the Expensive zone, the market is embedding too many years, and any mean reversion subtracts from returns even as the business continues to perform. A good business at the wrong price is still a poor investment.
For Copart at the time of writing, both engines appear to be working in the investor's favour. Over the past decade, Copart has compounded FCF per share at approximately 21% annually, one of the strongest rates among large businesses in any sector. That is the fundamental engine, running in full. The valuation engine has room to contribute as well: at 16 years of embedded cash flows in the Attractive zone, the market is not fully pricing the duration and quality of what Copart has built. An investor entering at this price is not relying on optimism, they are being paid by both the business performing and the price catching up.
The risk scenario is equally clear. If the stock moves into the Expensive zone, driven by price appreciation that outpaces fundamental growth, the valuation engine begins working against the position. In that scenario, the approach is to sell and reallocate capital to a quality business in the Conviction Universe.
7. Risks
Risk 1 - Insurance Company Concentration
Copart obtains approximately 81% of its vehicle volume from insurance company sellers. While no single insurer accounts for more than 10% of consolidated revenues, the collective dependence on a relatively small number of large carriers is a genuine structural risk. If the major US insurers were to consolidate their salvage operations, pursue vertical integration, or develop a credible alternative platform, Copart’s supply would be at risk.
The probability of this materialising is low. Insurance companies are not in the business of operating salvage yards. The operational complexity, the land requirements, and the need to build a global buyer network from scratch are formidable disincentives. Moreover, the financial returns Copart delivers to its insurance partners, through higher auction prices enabled by its global buyer network, are difficult to replicate. An insurer attempting to internalise this function would almost certainly achieve worse financial outcomes than it does today working with Copart.
The risk is real but its probability of materialising is low, and the mechanism by which it would occur requires insurance companies to act against their own financial interests.
Risk 2 - Autonomous Vehicles and Declining Accident Rates
This is the risk that deserves the most honest treatment in any Copart analysis, and the one with the longest time horizon.
The thesis is straightforward: if autonomous vehicles eventually reduce accident rates materially, or eliminate them entirely, the supply of total-loss vehicles that feeds Copart’s business would decline in parallel. A 50% reduction in accident rates would, all else being equal, reduce Copart’s volume significantly.
There are several important qualifications a serious investor must hold simultaneously.
First, the timeline for meaningful autonomous vehicle adoption is deeply uncertain. The promises of full self-driving technology have been pushed out repeatedly over the past decade. Even optimistic estimates place widespread adoption of truly autonomous vehicles well into the 2030s or beyond in the United States.
Second, vehicle complexity has historically been a tailwind for total loss frequency, not a headwind. Modern vehicles, with advanced driver assistance systems, cameras, sensors, and complex structural materials, are more expensive to repair than older vehicles. This has driven total loss frequency higher over the past thirty years even as vehicle safety technology has improved. The transition period from human-driven to autonomous vehicles is likely to involve even more complex and expensive-to-repair vehicles, maintaining or increasing total loss frequency in the near and medium term.
Third, even in a world where US domestic accident rates eventually decline, Copart’s international business and its global buyer network provide a degree of diversification that pure domestic exposure would not.
The autonomous vehicle risk is real, horizon-dependent, and does not present itself as an imminent threat to the business. An investor with a ten-year horizon should have it on the watch list. An investor with a twenty-year horizon needs to weigh it more carefully as part of any thesis.
What Would Change my Mind?
Meaningful and sustained market share losses to IAA or a new entrant, over two or more consecutive years, would be an early warning signal that the moat is weakening. If total loss frequency begins a sustained multi-year decline attributable to measurable reductions in accident rates from driver assistance technology, not just a single year of mild weather, that would require a fundamental reassessment of the long-term volume outlook. If a major insurance carrier publicly announces plans to internalise salvage operations, that would warrant immediate re-evaluation.
8. The Verdict
Copart is the kind of business that takes decades to build and is almost impossible to replicate once built. It occupies a structural position in a non-discretionary market, behind barriers that compound in strength each year, run by a management team whose interests are aligned with long-term shareholders and whose operational record demonstrates consistent execution across three decades.
The two risks discussed, insurance concentration and autonomous vehicles, are not trivial. They are real, they deserve ongoing monitoring, and they prevent this from being a thesis where no adverse scenario is imaginable. But neither risk, assessed honestly against the current time horizon, overrides the fundamental quality of what has been built.
At a valuation of 16 years of embedded cash flows, the market is asking for reasonable performance from a business with an exceptional track record. That is a combination worth owning.
Copart is the kind of business that quietly makes you wealthy if you give it time and leave it alone.
Disclosure: The author does not currently hold a position in $CPRT at the time of publication.
This report reflects the author’s personal views and is not an investment advice. Investing carries the risk of permanent capital loss. Read the full disclaimer here